

OUTLINEService overview
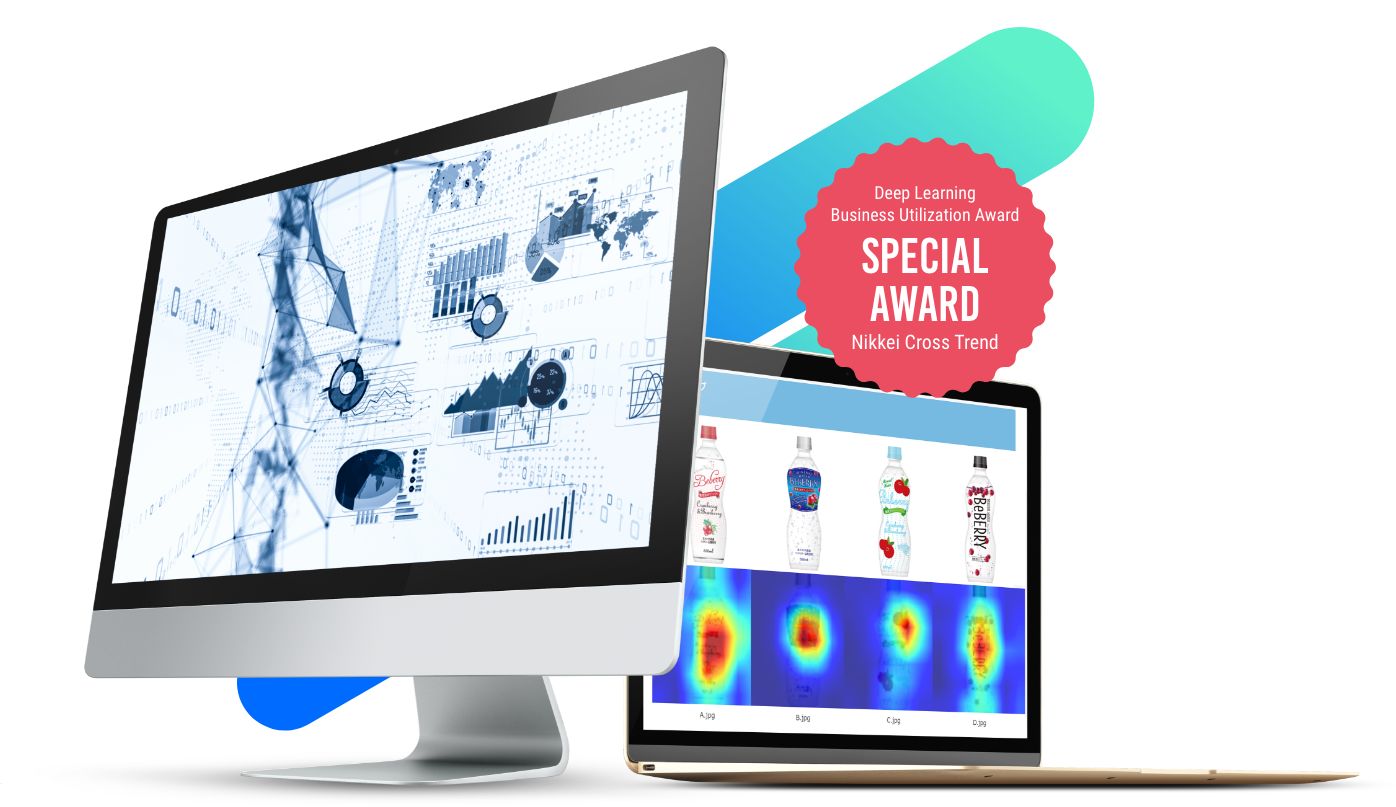
Let AI evaluate your packaging design!
Results are available in as little as 10 seconds for as little as 20,000 yen per piece.
What's more, our AI can even generate designs that resonate with consumers!
FUNCTIONMain functions and features
- 01
design evaluationPACKAGE DESIGN PREDICTION
Evaluation AI, created with training data from over 10 million people and joint research with the Yamazaki Laboratory of the University of Tokyo, provides results with objective indicators.
20,000 yen per image (*Fixed price plans are also available) and only 10 seconds to display results. It is possible to see the favorability rank of the design, as well as the evaluation by gender and age group.
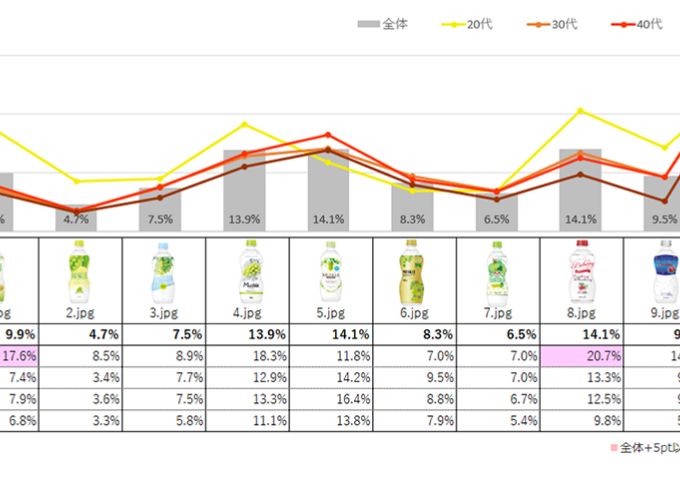
- function 01Preference Score
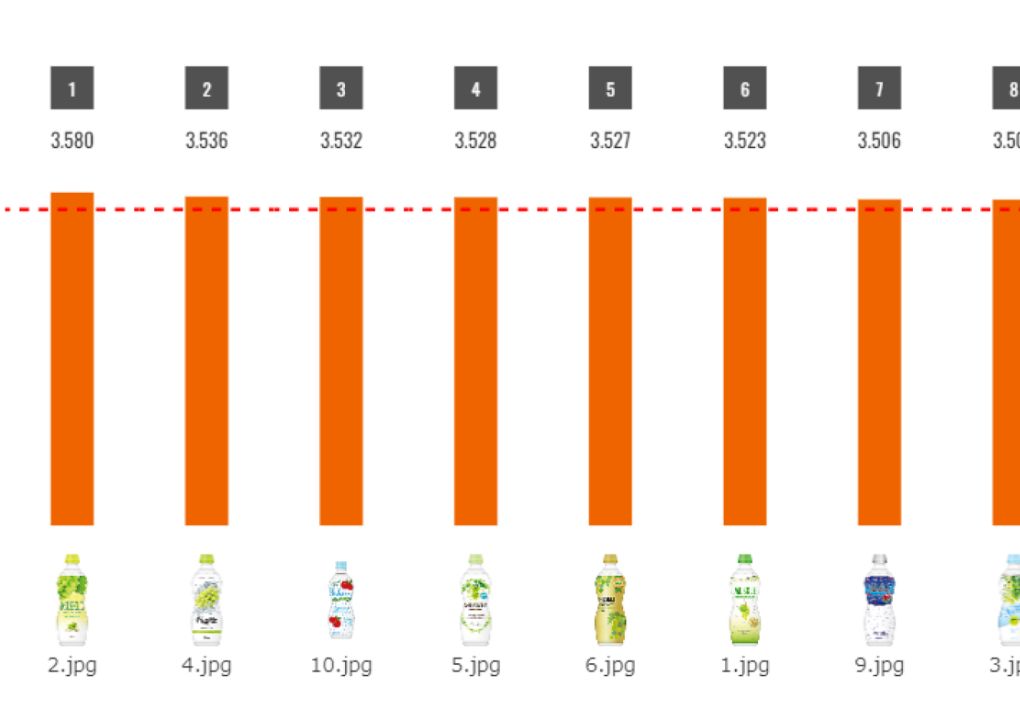
- Predicts the preference score of a packaging design as a weighted average from a maximum of 5 (like) to a minimum of 1 (dislike). It can be calculated for a total of 15 segments: overall, male/female, by age (20s/30s/40s/50s), and by gender x age. The results are displayed on the screen in graphs and tables. 3 reference values can be set (reference values/past projects/free settings) and you can see at a glance if the values exceed these reference values. Click here for more information on accuracy.
- function 02Heat Map
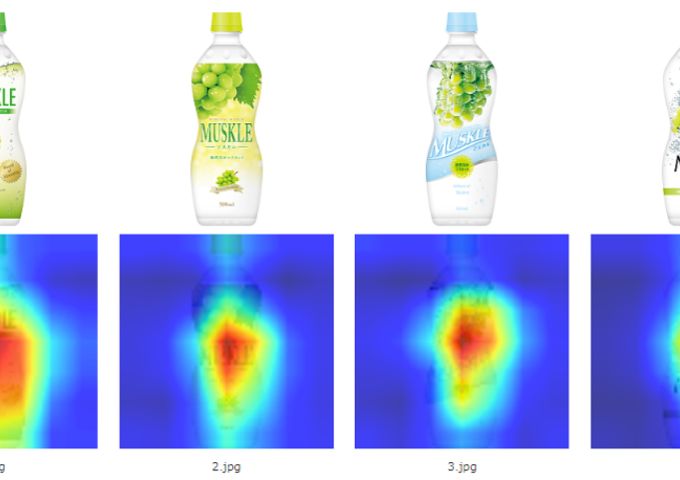
- Visualizes which parts of the package design attract attention. The higher the level of attention, the more it is shown in red, and the lower the level of attention, the more it is shown in blue. This is an important guideline for modifying the design. Results can be saved in PDF format.
- function 03Image Word Prediction 1
- The reason why respondents answered "like" can be predicted by the occurrence rate of 19 image words (18 excluding non-food and beverage: delicious). It is constructed using natural language processing technology from a huge number of free answers.
- function 04Image Word Prediction 2
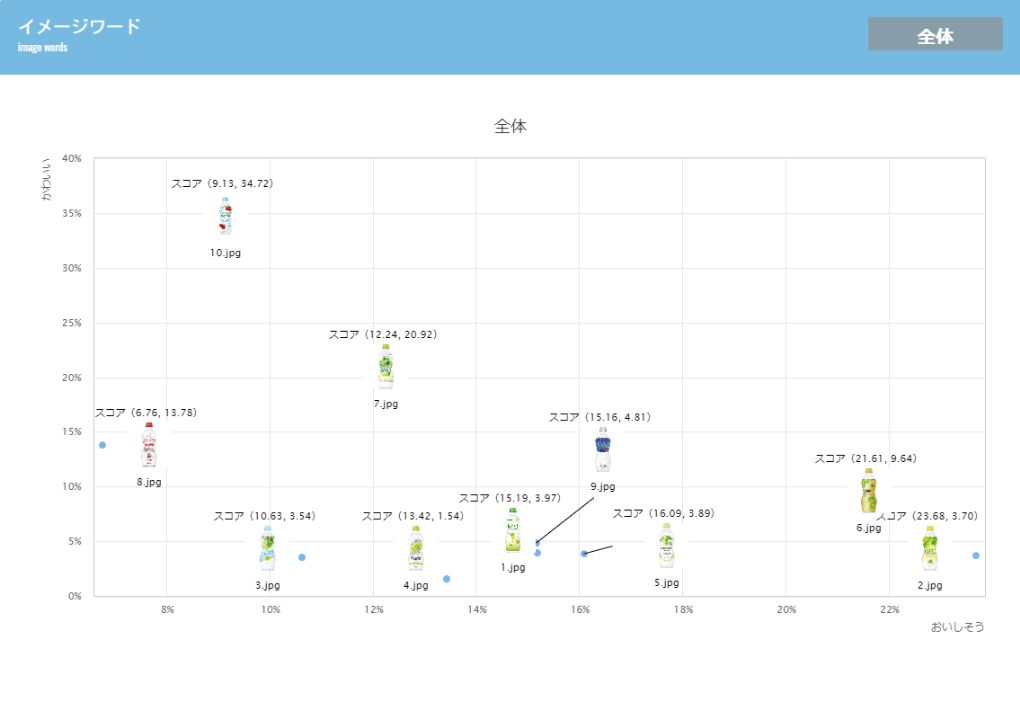
- You can create an image positioning map based on the combination of two of the 19 image words. By comparing the key words of the concept, you can see at a glance which of the words is responding to which of the 19 image words.
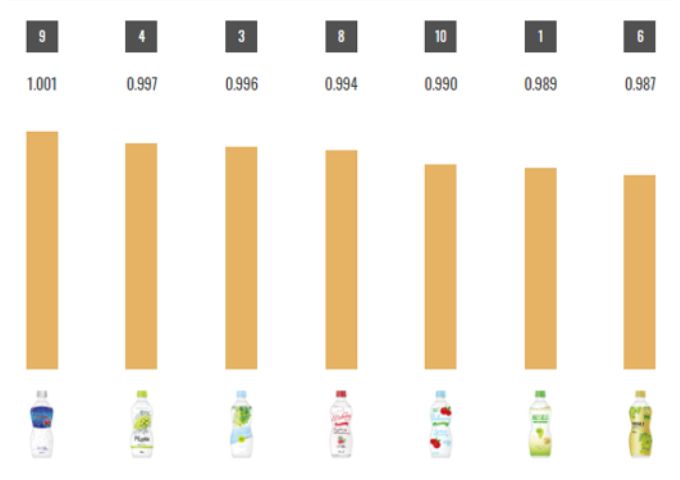
- function 05Preference Standard Deviation
-
Predicts the standard deviation (variation) of the preference score. The higher the value, the greater the difference between the preferred and non-preferred designs.
We recommend viewing this along with the preference score to easily determine if a design is universally liked or universally disliked.
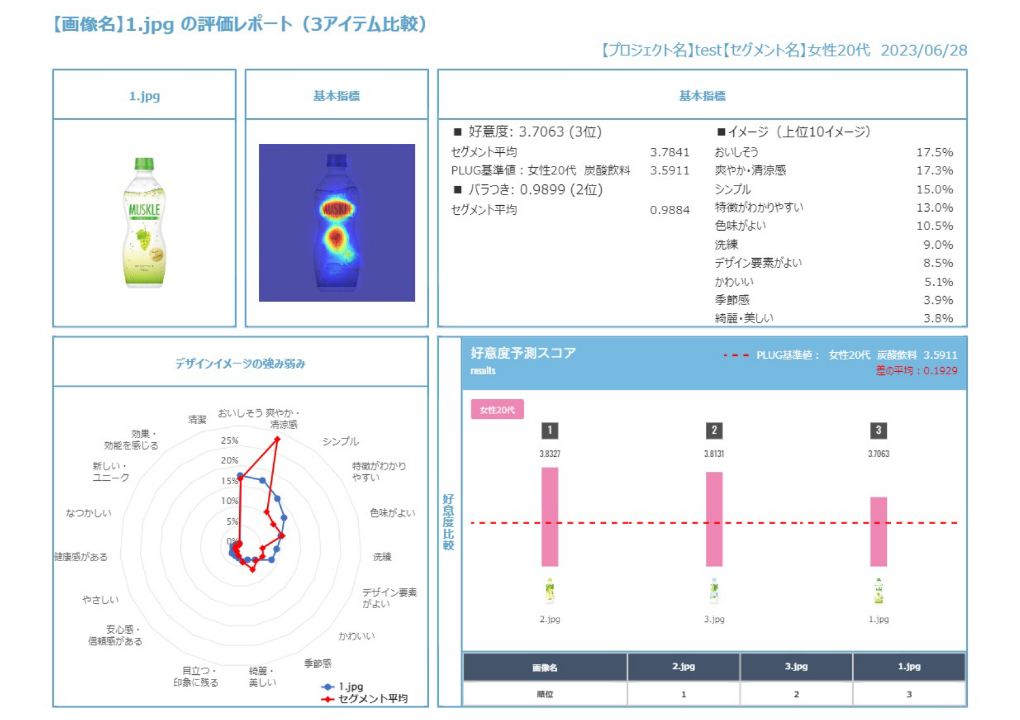
- function 06Batch Report
-
The report displays four menus organized by segment and image: preference score, image words, standard deviation, and heat map, all on a single sheet.
The report focuses on key elements for design decision making, such as preference and deviation rankings, preference graphs with reference values, top 10 image words, and a positioning map of their strengths and weaknesses.
FEATURESDesign Evaluation Features
Results available in 10 seconds to minutes
Just upload an image, select the variables you want, and you'll instantly see preference scores and graphs. You can also easily save the results as PDF and csv files.

Affordable
Subscribe to an ad hoc plan and you can use all four menus for up to 6 segments for only 20,000 yen per project.

Minimal information leakage
Since you only upload images, your design ideas will not be exposed to the outside world. You can use our service with peace of mind. Images are deleted after a certain period of time. (Scores will remain).

Use as many times as you like
With a monthly plan, you can use the evaluation of design proposals as many times as you like. This allows you to repeat hypothesis testing many times, which has been a limitation with conventional consumer research, making it possible to create a design with a high degree of perfection.

Package AI can help you solve various problems in package design development.
-
- CASE 01
- Too much time!

Consumer surveys take too long to produce results.
-
- CASE 02
- Not enough budget!

We want to conduct consumer surveys, but we don't have the budget.
-
- CASE 03
- One Word from the Top!
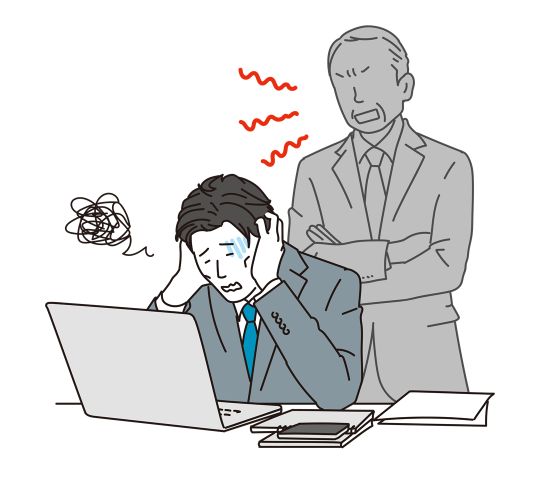
The design is decided by one voice of the boss or president.
-
- CASE 04
- What has changed?

It's hard to tell if the design is better than the original.
FLOW & DETAILFlow and Details of Evaluation and Forecasting
It takes only 4 steps!
- STEP1Select Menu
- STEP2Segment Selection
- STEP3Upload Image
- STEP4Category Selection
- function 01Preference Score
- Predicts the preference score of a packaging design as a weighted average from a maximum of 5 (like) to a minimum of 1 (dislike). It can be calculated for a total of 15 segments: overall, male/female, by age (20s/30s/40s/50s), and by gender x age. The results are displayed on the screen in graphs and tables. 3 reference values can be set (reference values/past projects/free settings) and you can see at a glance if the values exceed these reference values. Click here for more information on accuracy.
- function 02Heat Map
- Visualizes which parts of the package design attract attention. The higher the level of attention, the more it is shown in red, and the lower the level of attention, the more it is shown in blue. This is an important guideline for modifying the design. Results can be saved in PDF format.
- function 03-1Image Word Prediction 1
-
The reason why respondents answered "like" can be predicted by the occurrence rate of 19 image words (18 excluding non-food and beverage: delicious). It is constructed using natural language processing technology from a huge number of free answers.
- 1.Tasty (only for food and beverage)
- 2.Cute
- 3.Simple
- 4.Good design
- 5.Nostalgic
- 6.Kind
- 7.Confortable and reliable
- 8.Seasonal
- 9.Healthy
- 10.Effective
- 11.High-grade sense
- 12.Good color
- 13.New/unique
- 14.Stylish
- 15.Fresh
- 16.Characteristic
- 17.Standa out
- 18.Beautiful
- 19.Clean
- function 03-2Image Word Prediction 2
-
You can create an image positioning map based on the combination of two of the 19 image words.
By comparing the key words of the concept, you can see at a glance which of the words is responding to which of the 19 image words.
- function 04Predicting Preference Standard Deviation
-
Predicts the standard deviation (variation) of the preference score.
The higher the value, the greater the difference between the preferred and non-preferred designs.
We recommend viewing this along with the preference score to easily determine if a design is universally liked or universally disliked.
Data can be saved in PDF and CSV format.
- function 05Batch Report
-
The report displays four menus organized by segment and image: preference score, image words, standard deviation, and heat map, all on a single sheet.
The report focuses on key elements for design decision making, such as preference and deviation rankings, preference graphs with reference values, top 10 image words, and a positioning map of their strengths and weaknesses.